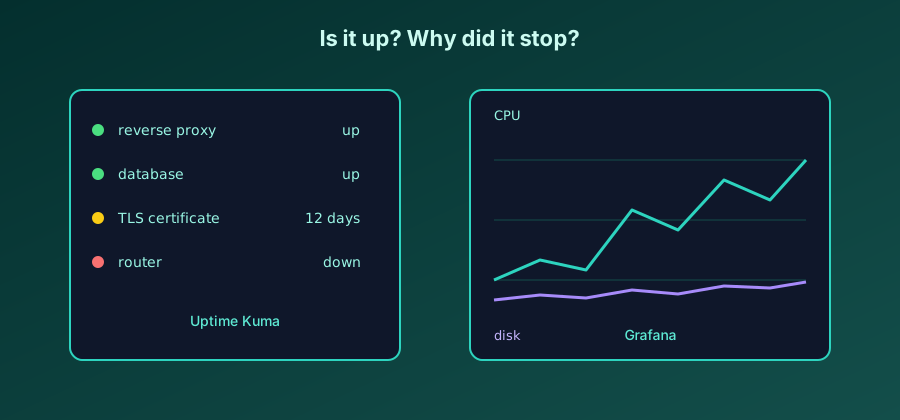
A homelab without monitoring is a homelab whose outages you discover at the moment you need it. Two tools cover the essentials: Uptime Kuma answers "is it working?", Grafana answers "why did it stop working?".
Level 1: Uptime Kuma
Uptime Kuma checks at regular intervals that a service responds, and alerts you when it goes down (email, Telegram, Discord…).
services:
  kuma:
    image: louislam/uptime-kuma:1
    restart: unless-stopped
    ports:
      - '3001:3001'
    volumes:
      - kuma_data:/app/data

volumes:
  kuma_data:
The probes I've configured:
| Target | Probe type | Interval |
|---|---|---|
| Reverse proxy | HTTPS | 60 s |
| Database | TCP | 60 s |
| TLS certificate | Expiry | 1 day |
| Router | Ping | 30 s |
Level 2: Prometheus and Grafana
To understand an outage, you need metrics. node_exporter exposes the machine's
state (CPU, memory, disk, network), Prometheus collects it, Grafana displays it.
scrape_configs:
  - job_name: node
    static_configs:
      - targets: ['node-exporter:9100']
A single dashboard is enough to start: CPU load, memory, remaining disk space, temperature. Most homelab outages come from a full disk.
Warning: don't monitor everything from day one. Every pointless alert teaches you to ignore alerts. Start with three or four truly critical probes.
Lesson learned after a 3 a.m. alert
Checklist
- Uptime Kuma installed and notifications tested
- Alert at 85% disk usage
- Grafana dashboard shared with the other members of the household
The real test of a monitoring setup is to deliberately shut down a service and check that the alert actually arrives.